Boost the performance of your applications with .NET profiling

Download 14-day free trial
A 2 minute overview of ANTS Performance Profiler, Redgate's .NET profiler

Introduction to ANTS Performance Profiler

ANTS Performance Profiler is a .NET profiler for desktop, ASP.NET, and ASP.NET MVC applications.

  • NEW: Profile your SQL queries and see execution plans
  • Find performance bottlenecks fast by profiling both the .NET code and the data access layer
  • Get rich performance data, right-down to line-level timings and expensive database queries
  • Save time going round in circles diagnosing and debugging – let the profiler do the hard work for you
  • Explore unfamiliar code bases

  • Enhanced data access profiling, with support for SQL Server, Oracle, MySQL, MariaDB, and PostgreSQL

Try it now, choose your version later.

Download free trial

1 Year Subscription

Standard

$31.75per user/per month (paid annually)

Improve application performance by profiling your own .NET code only.

Buy now

Pro

$47.50per user/per month (paid annually)

Identify performance bottlenecks in your own .NET code, as well as third-party code, framework methods, SQL Server queries and disk activity.

Buy now

Features

All the performance data you need in a single .NET profiler

From .NET code to database

View performance data for both your .NET code and database requests made by the .NET code.

Profile database requests your application makes to any SQL Server, Oracle, MySQL (or MariaDB), and PostgreSQL database.

This is ideal if you're using an ORM.

Read more about our database profiling support, on Simple-Talk.com

Understand web requests

View rich data about outbound HTTP requests made by your application, including request and response header information.

See all the information in the context of the .NET code which caused the request to run.

File I/O performance

Get comprehensive performance information on your application's disk activity.

More features

Jump straight to the slowest activity

The call tree in the .NET performance profiler shows you data for every method and identifies the most expensive methods, database queries, and web requests.

Drill down to slow lines of code with line-level timings

Profile C# or any other .NET code line by line, with precise timing data so you can find issues at a glance. Expensive lines of code are automatically highlighted for quick visual inspection.

Look at your code's database interaction*

Understand how your .NET code makes database queries and how those queries perform. ANTS Performance Profiler supports SQL Server and Oracle databases, whether local or remote.

*Only available in Pro edition

Capture outgoing web requests*

Look at your application's outgoing HTTP requests. Get data about the request and response headers, and see what .NET code caused them to run.

*Only available in Pro edition

Immediate feedback on application performance

Use the interactive timeline to check the CPU usage of your .NET or ASP.NET application and highlight problem areas to focus only on the data that matters.

Group methods by HTTP request*

Code and database activity are grouped by HTTP request, exposing performance problems on specific web pages.

*Only available in Pro edition

C# profiling for async code

Understand the performance of C#5 async code. View activity in the context of the code you wrote, and see how work being done asynchronously is related to the async method which caused it to run.

Decompile third-party code*

Find bottlenecks in third-party components and framework assemblies using integrated decompilation, powered by .NET Reflector.

*Only available in Pro edition

NEW: Profile SQL queries

Relate timings for your individual lines of .NET code right through to the SQL execution plans. Find out exactly why your SQL query is running slow.

Learn more about profiling SQL queries

Compare product editions

Standard* vs Pro vs Bundle

ANTS Performance Profiler is available in a Standard or Pro edition, or as part of the .NET Developer Bundle

Open an edition comparison table

If you have any questions about which edition is right for you, feel free to email us at sales@red-gate.com


* The Standard edition can only profile methods with source code (i.e. it will not profile Microsoft framework methods or third-party components). It uses PDB files to find out if you have the source code, so you will need the PDB files to see your performance data.

What our customers are saying

Supported technologies

  • Profile any .NET application:
    Windows Forms, ASP.NET Web applications, WPF, Windows services, XBAP, SharePoint and Silverlight 4+.
  • In any .NET language:
    Allows C# profiling, VB.NET profiling, and F# profiling.
  • Supports:
    .NET Core and .NET Standard.
  • Supports:
    .NET 2.0, 3.0, 3.5, 4.0, 4.5, 4.6, 4.7. Compatible with Windows 10, Windows 8, Windows 7, Windows Vista, Windows Server 2008, and Windows Server 2012.
  • Supports web apps on:
    IIS Express, IIS 6, IIS 7, IIS7.5, IIS8 and ASP.NET Web Development Server (Cassini).
  • Supports 64-bit profiling
  • Support for running .NET 4 processes:
    Attach to a running .NET 4 / 4.5 / 4.6 process with no need to restart your target application or website.
  • Azure profiling:
    Profile worker and web roles running in the local Azure emulator
  • Cloud support:
    Install on Microsoft Azure and Amazon EC2 to profile cloud-hosted sites and applications. (You'll need to reinstall ANTS Performance Profiler any time a cloud instance is torn down.)
  • Visual Studio Integration:
    Compatible with Visual Studio 2010, 2012, 2013, 2015, and 2017.

.NET performance profiling resources

Articles

ASP.NET application performance improvements on Azure

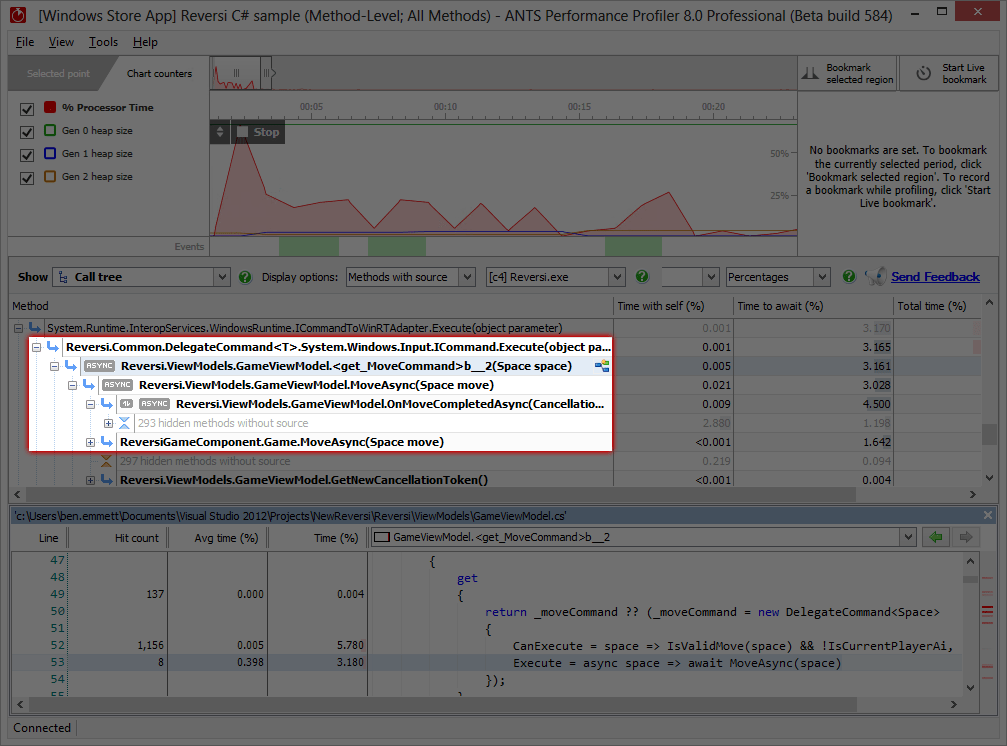
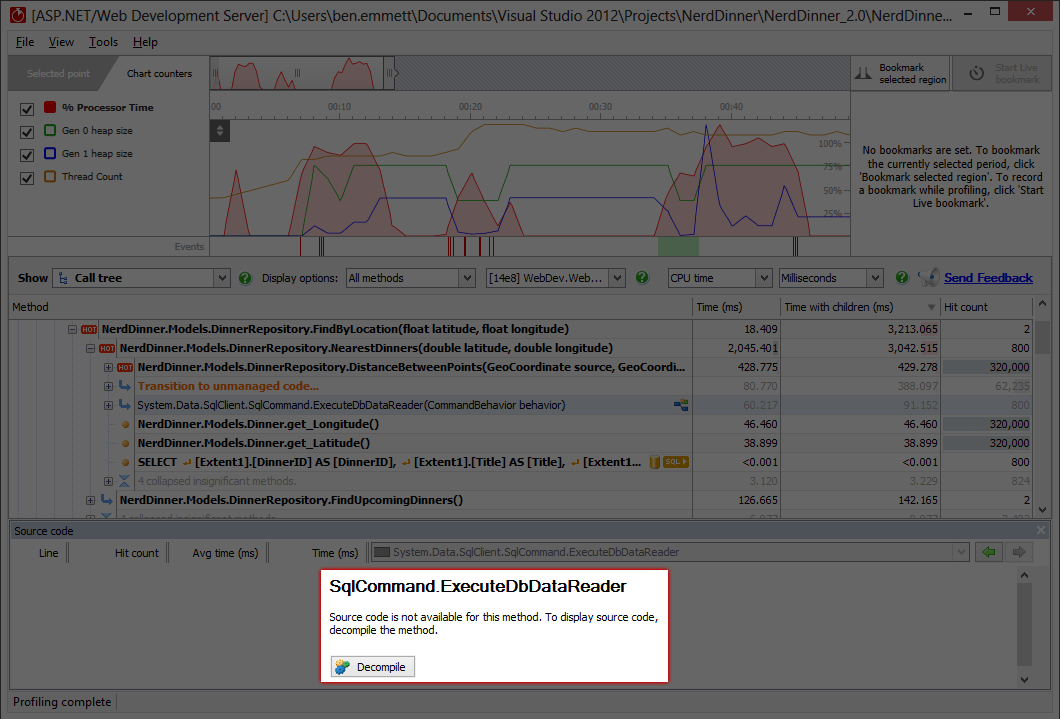
ASP.NET, Azure Web Roles, and Azure SQL Database provide a great way to build highly scalable, data-heavy applications, without having to worry about the underlying infrastructure. In this walkthrough we'll take a look at profiling such an application.

Read the article

Is SQL Server killing your .NET application performance?

When a .NET application suffers from performance problems, it's common to assume the database is at fault. Ben Emmett examines why this often isn't the case, and shows how you can dig into .NET application performance and .NET's use of SQL Server with ANTS Performance Profiler.

Read the article

How to check third-party .NET code performance

To understand and improve .NET performance, you need to examine every aspect of your code. Bottlenecks sometimes lie in the way your code calls methods in third-party or framework assemblies. In this article, you’ll see how ANTS Performance Profiler can help you find these problems.

Read the article

Licensing options

Floating license

Although we don't offer a floating license, Redgate's licensing model includes volume discounts. These are often more cost-effective than a typical floating license model, and they let all your users work with their tools at the same time, without waiting for a license to become free.

In the odd case that the volume discount scheme doesn't make life easier for you, we'll happily review your circumstances and work with you to find a better solution.

Personal licenses

We offer a 50% discount for a single personal license for personal use, hobbyist use, and home use. This license is not available to companies.

Open source licenses

We offer a range of free licenses for use on your open source projects. Find out more

Licenses for education, non-profit, charities, and start-ups

We've helped lots of organizations in these categories over the years, so we're very happy to discuss circumstances around our licensing. Please get in touch directly to see how we can help.

Student licenses

We're happy to provide free non-commercial use licenses for individual students in education, upon verification. Please contact us to apply for a license of this kind and to get more information.